Memory Bandwidth Engineering: The True Bottleneck in LLM GPU Architecture
MemoryMatters #29

GPU architecture limitations often create bottlenecks in large language model systems. NVIDIA's A100 boasts impressive specs with 108 Streaming Multiprocessors and 312 FP16 TFLOPS. Yet many teams struggle to achieve optimal performance while deploying LLMs.
Large-batch inference in LLMs stays memory-bound, and DRAM bandwidth saturation emerges as the biggest problem. This explains why many teams cannot fully utilize their GPU compute capabilities. The GPU's structure and memory hierarchy are the foundations of this limitation. The GPU architecture's optimization doesn't always match LLM workloads, which creates unexpected performance limits.
Here I try to explore GPU architecture in practical terms providing a GPU-LLM usage overview that shows common bottleneck locations. At the end we will discuss some potential areas for optimization to help reduce LLM commentary generation time.
Understanding GPU Architecture for LLMs
Image Source: GoPenAI
"Graphics Processing Units (GPUs) are essential for training and running LLMs due to their ability to handle parallel computations." — Label Your Data Team, AI data labeling and model training experts
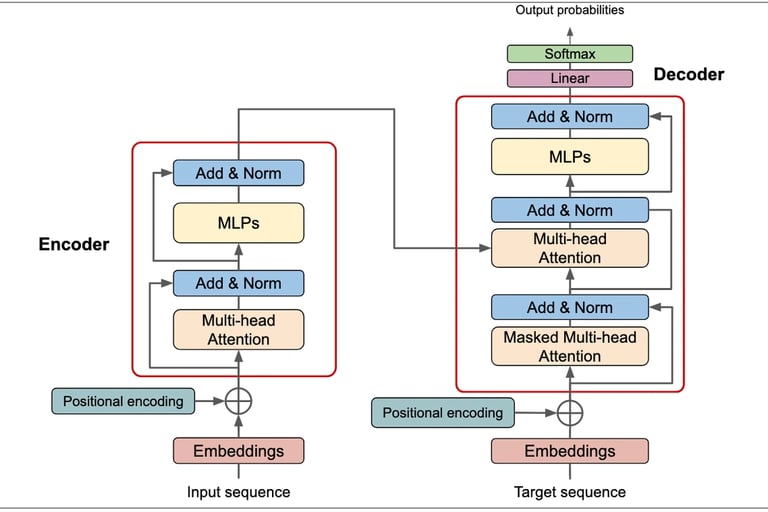
GPUs are the vital foundation of today's LLM rise because they excel at parallel processing. CPUs work best with sequential tasks, but GPUs can handle thousands of calculations at once - a perfect match for transformer models' matrix multiplication requirements.
What is GPU architecture?
GPU architecture represents specialized hardware designed to perform massive parallel computations through thousands of small processing units working in sync. GPUs work exceptionally well with matrix operations that power LLM workloads [1]. These processors split computational tasks across multiple execution units and process large data batches simultaneously.
GPUs started as graphics rendering tools but have grown into computing powerhouses. NVIDIA's CUDA (Compute Unified Device Architecture) platform now leads the AI space. It lets developers directly access the GPU's virtual instruction set and parallel computational elements [1]. Developers can specify thread-level parallelism, which optimizes complex deep learning operations.
Key components: SMs, memory hierarchy, and cores
Streaming Multiprocessors (SMs) serve as the GPU's basic processing unit. Each SM works independently with its own register files, shared memory, and L1 cache [1]. NVIDIA's A100 GPU packs 108 SMs, and each contains specialized execution units built for different operation types [2].
Each SM contains:
CUDA cores: Standard processing units that handle floating-point operations
Tensor cores: Specialized units built for matrix multiplication operations in LLM workloads
Transformer engines: High-end GPUs feature these engines that analyze transformer layers and pick optimal precision formats [1]
Memory hierarchy significantly impacts overall performance:
Registers: Ultra-fast memory spots within each core for immediate processing
L1 Cache/Shared Memory: Fast memory inside SMs (128 KB per SM in Volta architecture) runs seven times larger than earlier versions [3]
L2 Cache: Larger shared cache across multiple SMs reduces slower memory access (40 MB in A100) [2]
High Bandwidth Memory (HBM)/VRAM: Main GPU memory holds model weights (up to 80 GB in high-end cards) [2]
FLOPS (Floating Point Operations Per Second) measures raw computational power. Modern GPU tensor cores speed up matrix operations in LLM workloads dramatically. Each Tensor Core executes 64 floating point FMA operations per clock. Eight Tensor Cores in one SM deliver 512 FMA operations (or 1024 individual floating point operations) per clock [3].
GPU architecture diagram overview
GPUs consist of multiple SMs arranged in clusters that connect to memory controllers interfacing with HBM. NVIDIA's GV100 GPU showcases this design with:
Six GPU Processing Clusters (GPCs)
84 Streaming Multiprocessors (SMs)
5376 FP32 cores, 2688 FP64 cores, and 672 Tensor Cores
Eight 512-bit memory controllers (4096 bits total) [3]
This setup creates a hierarchy that breaks down tasks across SMs. Each SM divides work into warps (groups of 32 cores in NVIDIA GPUs) that run instructions in lockstep [4]. Such structure enables massive parallelism needed for LLM operations.
LLM operation loads model weights from DRAM into SMs for computation. System performance depends more on moving billions of parameters between memory and compute units efficiently than raw computational power [5].
How GPUs Execute LLM Workloads
GPUs handle LLM workloads differently from CPUs. The GPU architecture follows specific execution patterns that allow massive parallel processing but trades off some flexibility.
Thread blocks and warps explained
NVIDIA GPUs run LLM operations through a system called thread blocks. These blocks contain multiple threads that run the same kernel function on different data points. The compute work distributor assigns these blocks to Streaming Multiprocessors (SMs). The blocks stay there until they finish running.
The SMs break down thread blocks into warps - groups of 32 parallel threads. These warps execute in SIMT (Single Instruction, Multiple Thread). All 32 threads process identical instructions at the same time but work with different data [6].
A warp consists of 32 "lanes" with one thread per lane. NVIDIA's architecture lets each thread in a warp:
Access its own registers
Load from different memory addresses
Take different control paths as needed [6]
The GPU works with the CUDA compiler to keep threads running the same instructions together. This maximizes performance. The warp scheduler picks active warps and sends them to execution units. Each SM can handle several warps at once [7].
Tensor Cores vs CUDA Cores
Modern GPUs use two main types of processing units for LLM workloads:
CUDA cores, introduced in 2007, excel at general parallel computing tasks. These versatile processors handle sequential processing, support high-precision operations (FP32/FP64), and manage various GPU computing tasks [8].
Tensor Cores came with NVIDIA's Volta architecture in 2017. These specialized units speed up deep learning through matrix multiplication. They stand out in LLM workloads because of their:
Built-in matrix multiply-accumulate engine
Support for mixed precision (FP16, FP32, INT8, INT4, FP8)
Multiple operations per clock cycle [8]
The performance gap is huge. Tensor Cores train AI models much faster than CUDA cores alone. Tensor Cores process matrix operations at a much higher speed - crucial for LLM workloads [9].
Prefill vs decode phases in LLM inference
LLM inference happens in two distinct phases, each with unique performance traits:
The prefill phase processes input tokens together to create intermediate states before generating output.
Works like a parallel matrix-matrix operation
Uses the GPU fully
Depends mostly on compute power
Makes good use of the GPU's parallel processing [10]
The decode phase creates output tokens one after another.
Needs previous tokens to generate new ones
Runs as a matrix-vector calculation
Leaves GPU power unused
Spends more time moving data than computing [10]
These phases affect performance differently. Prefill determines "Time to First Token" (TTFT), while decode sets "Time per Output Token" (TPOT). Interactive apps need TTFT under 3 seconds and TPOT between 100-300ms [11].
Knowing how these phases work helps optimize LLM systems. This knowledge proves especially useful when creating batching strategies that balance prefill and decode workloads.
Memory vs Compute: The Real Bottleneck?
"In a world in which GPU hours are a highly coveted resource, training a fully dense model over a massive scale is prohibitively expensive in terms of both time and cost." — NVIDIA Developer Team, Technical experts at NVIDIA, leading GPU manufacturer
The delicate balance between memory bandwidth and computational power determines how LLM systems perform. Performance depends more on this balance than raw specifications at the time of running most LLM workloads.
What is arithmetic intensity?
Arithmetic intensity helps identify bottlenecks in GPU operations. This fundamental metric shows the ratio of computational operations (FLOPs) to memory bytes accessed during execution [12]. We can see how efficiently a workload makes use of available computational resources compared to memory transfers.
The formula is straightforward: Arithmetic Intensity = Number of floating-point operations / Number of memory bytes accessed [12]
LLMs show substantial variations in arithmetic intensity between operations. Matrix multiplications have higher intensity, while attention mechanisms keep relatively constant intensity whatever the batch size [4].
How to tell if you're memory-bound or compute-bound
A quick comparison reveals your system's bottleneck status:
Your system becomes memory-bound when the workload's arithmetic intensity falls lower than your GPU's OPs:Byte ratio. This means data movement between memory and processing units limits performance [2]. Adding more computational power won't help much.
The system becomes compute-bound when arithmetic intensity rises higher than your GPU's OPs:Byte ratio. Processing capacity becomes the limiting factor [2]. Additional computational resources would improve performance in this case.
Let's look at Llama2-7B. It has an arithmetic intensity of approximately 62 operations per byte. An NVIDIA A10 GPU has an OPs:Byte ratio of 208.3 [13]. This configuration clearly shows memory-bound behavior during autoregressive token generation.
GPU memory architecture and HBM saturation
HBM acts as the main storage for model weights and intermediate values in GPU memory architecture. The decode phase moves weights from DRAM to on-chip memory repeatedly, which can create bottlenecks [14].
New research highlights how DRAM saturation in attention mechanisms leads to throughput plateaus when batch sizes are large [4]. The system behaves differently as batch size grows:
Attention mechanisms take up more execution time compared to matrix multiplications
DRAM saturation leaves warps unallocated, preventing full use of GPU resources
The system's performance stalls despite having computational capacity available
This explains why increasing batch size beyond certain points offers limited benefits. The memory system reaches saturation while compute units sit partially idle [4].
Prefill and decode phases show distinct characteristics. Parallelized operations make the prefill phase compute-bound. The decode phase becomes memory-bound because of sequential token generation and limited parallelism [15].
These dynamics point to where optimization efforts should focus - memory efficiency matters more than raw computational power.
Optimizing Performance Without More Hardware
You don't need expensive hardware to get the best performance from your LLM. The right software optimization techniques can help you get more throughput from your existing GPU setup.
Batching strategies and their limits
Your GPU utilization becomes more efficient when you group multiple inference requests into a single forward pass through the model. The throughput improves up to 6x when batch sizes increase from 1 to 32 or 64 compared to single-request inference [16]. The gains hit a ceiling eventually, especially in smaller models [4].
Memory-bound attention mechanisms cause this performance plateau across batch sizes. Attention kernels don't benefit much from larger batches because DRAM reads limit their performance [4]. Adding more requests only increases latency once DRAM bandwidth reaches its limit caused by specific loaded latency scenarios.
Using model replication to improve throughput
Model replication offers a better alternative to just maximizing batch size to tap into unused compute power. A Batching Configuration Advisor (BCA) helps optimize memory allocation and frees up GPU memory resources without fully hurting throughput [4].
The extra memory can support parallel workloads through model replication. Small language models benefit most from this approach. These models might fit hundreds or thousands of requests on a single GPU but fail to use its full computing power [4].
Quantization and sparse models for efficiency
Speed and memory efficiency improve when you reduce precision through quantization. Most models work well with 8-bit or even 4-bit precision though they typically train at 32-bit or 16-bit precision [17].
Sparsity patterns help remove extra parameters without losing accuracy. The Sparse-Llama-3.1-8B-2of4 model keeps its accuracy even after removing two of every four parameters (50% pruned) [18]. A combination of 4-bit quantization and 2:4 sparsity led to an impressive 3.0x speedup on A5000 and A6000 GPUs [18].
Kernel fusion and FlashAttention
Kernel fusion techniques at the GPU structure level combine multiple operations in the same computational kernel. This cuts down on repeated memory access operations that take up most execution time [19].
FlashAttention shows this principle in action by combining all attention operations into a single CUDA kernel through tiling and recomputation techniques [4]. It processes matrices in smaller blocks directly in fast on-chip SRAM, making it 3x faster than traditional attention mechanisms [1]. This memory optimization reduces attention complexity from O(n²) to O(n), which allows for longer sequences and larger batches in the same GPU memory setup [1].
Identifying and Fixing Bottlenecks in Your System
The first step to tune LLM performance is finding where your system needs help. Research from Weights & Biases shows all but one of these users achieve less than 15% GPU utilization when running LLM workloads [20]. This suggests significant potential to improve performance with existing hardware.
Using profiling tools like Nsight
NVIDIA's Nsight Systems helps you learn about LLM performance at the application level. This powerful tool captures detailed metrics about GPU resource usage with minimal performance overhead. Here's how to profile specific execution phases:
Set the TLLM_GPTS_PROFILE_START_STOP environment variable to target specific iterations
Add -c cudaProfilerApi flag to enable explicit API triggers
Include --capture-range-end="repeat[]" to continue profiling after stop calls [5]
Nsight lets you switch the CUDA profiler runtime API on and off. This creates smaller, more manageable profile files that pinpoint bottlenecks in specific model components.
Reading GPU utilization metrics
These four key metrics quickly reveal bottlenecks:
Volatile GPU Utilization (0-100%): The GPU's workload intensity
GPU Memory Usage: The VRAM needed for model weights and activations
Token Throughput: The number of tokens processed each second
Latency Percentiles: The system's consistency [21]
Your GPU might show low utilization but high memory usage. This usually points to memory bandwidth limits rather than compute power issues—a common challenge in LLM inference.
Finding the right batch size for your model
Batch size significantly affects memory usage and performance. The GPU memory requirements grow linearly with each sequence added to your batch, mainly because of increasing KV cache size [10]. These approaches help handle "CUDA out of memory" errors:
Lower batch size in steps (e.g., from 64 to 32)
Use gradient accumulation with smaller mini-batches
Run tests with different input lengths beyond standard prompts [22]
The best batch size depends on your specific needs. Test with various input sizes since memory use scales with both batch size and sequence length. The sweet spot is the largest batch that fits in memory without causing system slowdown or waste.
Conclusion
A deep understanding of GPU architecture changes our approach to LLM system optimization completely. DRAM bandwidth limits, not raw computational power, hold back LLM performance in most cases. This explains why many organizations see poor results even after buying high-end hardware.
The quickest way to boost performance comes from software tweaks rather than new hardware. Batching strategies can improve throughput a lot, even with memory limits in place. Model replication helps use idle compute resources better. Quantization and sparsity cut down memory needs without losing model quality.
Good profiling shows exactly where your system slows down. When you see low GPU use but high memory consumption, it points to memory bandwidth issues. This pattern shows up often in LLM workloads. This knowledge helps you focus your optimization work where it matters most.
The best LLM systems need more than just good specs - they need a solid grasp of how GPUs actually run these models. The methods covered can help you get much more from your current hardware. By tweaking the system interfacing through access optimization you may be able to turn a 4-hour job into a 20-minute one without spending extra money. This practical way of doing things saves money and makes advanced AI available to teams with tight budgets.
References
[1] - https://medium.com/@sachinkalsi/flashattention-an-advancement-in-gpu-acceleration-for-training-llms-74528a932c49
[2] - https://docs.nvidia.com/deeplearning/performance/dl-performance-gpu-background/index.html
[3] - https://images.nvidia.com/content/volta-architecture/pdf/volta-architecture-whitepaper.pdf
[4] - https://arxiv.org/pdf/2503.08311
[5] - https://nvidia.github.io/TensorRT-LLM/performance/perf-analysis.html
[6] - https://developer.nvidia.com/blog/using-cuda-warp-level-primitives/
[7] - https://en.wikipedia.org/wiki/Thread_block_(CUDA_programming)
[8] - https://www.wevolver.com/article/tensor-cores-vs-cuda-cores
[9] - https://acecloud.ai/resources/blog/cuda-cores-vs-tensor-cores/
[10] - https://developer.nvidia.com/blog/mastering-llm-techniques-inference-optimization/
[11] - https://huggingface.co/blog/tngtech/llm-performance-prefill-decode-concurrent-requests
[12] - https://www.iguazio.com/glossary/arithmetic-intensity/
[13] - https://www.baseten.co/blog/llm-transformer-inference-guide/
[14] - https://www.databricks.com/blog/llm-inference-performance-engineering-best-practices
[15] - https://www.adaline.ai/blog/understanding-gpu-for-inference-in-llms
[16] - https://www.hyperstack.cloud/technical-resources/tutorials/how-to-use-batching-for-efficient-gpu-utilization
[17] - https://medium.com/data-science-at-microsoft/exploring-quantization-in-large-language-models-llms-concepts-and-techniques-4e513ebf50ee
[18] - https://developers.redhat.com/articles/2025/02/28/24-sparse-llama-smaller-models-efficient-gpu-inference
[19] - https://www.aussieai.com/research/kernel-fusion
[20] - https://www.linkedin.com/pulse/inefficient-gpu-utilization-llm-inference-enterprises-john-willis-xaesf
[21] - https://www.linkedin.com/pulse/optimizing-nvidia-gpu-utilization-llm-inference-deep-dive-markevich-rqcge
[22] - https://rumn.medium.com/benchmarking-llm-performance-token-per-second-tps-time-to-first-token-ttft-and-gpu-usage-8c50ee8387fa